Google Tag Manager (GTM) is an essential tool for marketers and analysts, offering a streamlined way to manage website tracking without needing constant developer support. However, while GTM simplifies tag management, implementing it effectively requires a strategic approach. A poorly structured GTM setup can lead to inaccurate tracking, data discrepancies, and slow website performance.
To help you maximise the power of GTM, James Seddon, our Digital Strategy Lead at Arke, shares his top six best practices for a cleaner, more efficient tracking setup.
What are Google Tag Manager (GTM) Best Practices?
1. Give yourself a stable foundation
A well-organised GTM container is key to keeping your tracking clean and manageable. Clearly naming your tags, triggers, and variables makes troubleshooting and future updates far easier. Instead of generic names like ‘Tag 1’ or ‘Conversion Event,’ use descriptive and standardised naming conventions such as ‘Arke – GA4 – Form Submission – Contact Page’ or ‘Arke – Facebook – Purchase Event.’ This ensures clarity, consistency, and ease of maintenance, especially when multiple team members or agencies are involved.
A structured approach also involves categorising tags based on their function and separating analytics tags from marketing pixels and third-party tracking scripts. This helps maintain an organised environment and avoids confusion when making updates. The easiest way to do this is through GTM’s built-in folders function.
2. Utilise the Data Layer
The data layer is your best friend when it comes to accurate tracking. Rather than scraping elements from the Document Object Model (DOM), which can break with website updates, a structured data layer ensures data integrity and stability. It acts as a centralised hub for data collection, feeding relevant information to GTM, which then sends it to the various destinations you require.
For example, instead of extracting transaction values from the webpage using CSS selectors, push them into the data layer like this:
dataLayer.push({
‘event’: ‘purchase’,
‘ecommerce’: {
‘transaction_id’: ‘12345’,
‘value’: 99.99
}
});
By doing this, you create a more reliable and flexible tracking setup that won’t break when minor changes are made to the website’s front end.
3. Avoid Tag Bloat
Adding too many tags can slow down site performance and create unnecessary complexity. Each tag added increases the risk of conflicting scripts, longer page load times, and potential errors.
To prevent tag bloat:
-
- Regularly audit your GTM container and remove redundant or outdated tags.
-
- Consolidate multiple tracking tags where possible. For instance, instead of having separate event tags for different buttons, use a single tag with dynamic triggers.
-
- Leverage GTM’s built-in functions instead of adding excessive custom JavaScript.
-
- Use lookup tables and regex to manage multiple tracking IDs efficiently.
4. Test Before You Publish
GTM’s Preview Mode exists for a reason – use it! Testing before publishing ensures that your tags fire correctly and that data is being sent to the right platforms. Before making changes live, run tests to verify:
-
- Are the correct tags firing at the right time?
-
- Is the data being captured accurately?
-
- Are there any errors in the GTM container that could disrupt performance?
Additionally, integrating tools like Google Tag Assistant, Chrome DevTools, and TagDebugger can help diagnose any issues and provide deeper insights into how your tracking setup is functioning.
5. Manage User Access Wisely
Not everyone needs full control over GTM. Granting unrestricted access to all users can lead to accidental misconfigurations, data loss, and untracked conversions.
A quick summary of the different access levels can be found below.
-
- Read-Only – Allows users to review tags but not make changes.
-
- Edit – Enables users to configure and edit tags but not publish.
-
- Approve – Requires changes to be reviewed before being published.
-
- Publish – Full control over implementing changes live.
6. Document Everything
Tracking implementations can become complex, especially over time. Keeping a detailed record of what’s been implemented, why, and by whom is essential for maintaining a robust tracking setup.
-
- Use GTM’s ‘Versions’ feature to monitor changes and roll back if necessary.
-
- Maintain an external Measurement Framework that documents tags, triggers, and variables used, along with their purpose.
-
- If you’re working with an agency or multiple teams, a shared knowledge base can prevent duplicate efforts and miscommunication.
How Arke Can Help
At Arke, we don’t just implement GTM, we optimise it for long-term success. Whether you’re setting up GTM for the first time, improving your tracking capabilities, or refining an existing container, we ensure best practices are followed so your tracking is reliable, scalable, and aligned with business objectives.
Here’s how we can support your GTM implementation:
-
- Strategic Setup & Tagging Structure – We ensure your GTM is well-organised, with clear naming conventions and logical categorisation, making future updates seamless.
-
- Advanced Tracking Solutions – From enhanced eCommerce tracking to detailed scroll depth monitoring and custom event tracking, we implement tailored solutions that go beyond basic setups.
-
- Data Layer Implementation – We ensure your website is structured with a robust data layer, improving the accuracy and reliability of your tracking.
-
- Tag Audits & Optimisation – Our team conducts in-depth audits of your GTM container to identify inefficiencies, reduce tag bloat, and enhance performance.
-
- Error Debugging & Troubleshooting – We identify and resolve tag firing issues, ensuring smooth data flow to platforms like Google Analytics, Meta Ads, and LinkedIn.
-
- Training & Support – We offer hands-on training sessions to help your team understand GTM, making them self-sufficient in managing and troubleshooting tracking setups.
Whether you need a fresh GTM setup or a fine-tuned solution, Arke is here to help. Get in touch today to ensure your tag management is working seamlessly for your business and driving the insights you need.
Results Day 2024
Results Day 2024 is officially over!
We hope that it was a successful day for education institutions and students alike!
It has been a day full of insights and information and, boy, did we learn a lot. Arke was right there, providing real-time updates on Results Day and Clearing trends, developments, and news. The results may still be pouring in as the Clearing portal remains open until 21st October.
Missed any of the action on Results Day? Don’t worry—we’ve compiled all the essential information you need into our comprehensive Results Day Factsheet for 2024. This year, we’ve seen some significant shifts in student preferences and trends that could shape the future of education and youth marketing.
Our Factsheet
Our factsheet provides a detailed analysis of the latest student trends, including which courses are rising in popularity and which are seeing declines. You’ll discover important insights on how these changes are influencing student behaviour, the impact on different subject areas, and what this means for universities, educators, and marketers targeting young audiences.
We also dive deep into the implications of these trends for youth marketing strategies. Understanding where student interests are heading and how preferences are evolving is crucial for staying ahead in the dynamic world of youth engagement. These stats and insights from Results Day 2024 highlight the trajectory of trends for the rest of the year for younger audiences. Whether you’re an education institution looking to stay ahead of the trends, or a brand that markets to Gen Z audiences, these insights can help to boost your strategy.
As brand and performance marketing leaders, our full report will showcase the latest info and the best tactics to make campaigns in all sectors shine for the rest of 2024.
Fill out the form below to receive your Results Day Factsheet!
Get in touch today to find out how our expertise can help by using data and insights from this year to fine-tune your 2025 Clearing strategy.
It has been a whirlwind of a month since the launch of Google Analytics 4 (GA4), the latest and most advanced iteration of the analytics platform. For businesses everywhere, GA4 presents a significant opportunity to gain valuable insights into their online presence and customer journeys – but what if many brands are finding out it’s not working as the powerhouse platform it should be?
With new updates come new challenges, and we’ve been keeping a track of reactions in response to the new analytics system. So how can we solve these and utilise GA4 for the ultimate tracking platform it was created to be?
We’re going to review the top three challenges we’ve seen for businesses and reveal our solution to not only getting your data back on track, but creating the ultimate dashboard to bring more ROMI than ever before…
So what are we waiting for?
We’re getting started with a few reactions to Search Engine Land’s ‘GA4 readiness’ poll, with some extracts from the top 10 things users hate about GA4.
The user interface is the biggest issue
GA4’s user interface has been a prominent issue highlighted by respondents, and they didn’t hold back in terms of expressing their frustrations. Adjectives like “slow” and other less publishable terms were used to describe the UI.
Navigating through segments and dimensions in GA4 is a bit more lengthy compared to the simplicity of Universal Analytics. In GA4, the process involves opening customisation or adding comparison, clicking “add filter,” selecting a dimension from a beefy dropdown, followed by selecting a dimension value from another dropdown, and finally applying the filter. This process seems to have become frustrating for users when analysing multiple patterns on a daily basis, especially for those who may have been familiar with a faster workflow.
How to tackle this
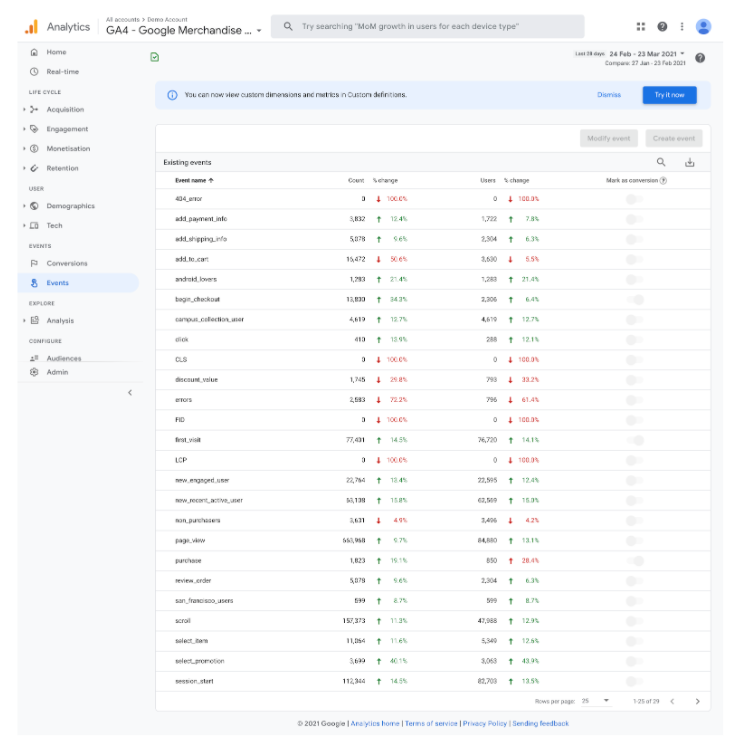
Utilising custom dimensions is an essential component for maximising the benefits of Google Analytics 4. While there are a variety of predefined and auto-tracked events available, these predefined events might not offer the specific data you require. With custom dimensions and event parameters, you can track everything that’s relevant to your business including user based data, event based data and purchase data. There is even a handy guide to set these up on Google’s website here.
It’s proving to be pretty hard to use
Numerous marketers from diverse backgrounds have expressed their concerns regarding the usability of GA4. Even experienced advertisers are encountering difficulties while trying to familiarise themselves with the intricacies of the new platform.
There have been quite a few changes, including the introduction of new and improved data streams. Data streams are a key feature of GA4 and allow you to separate the data that enters your GA4 property for example from your web and app.
If you didn’t add all your streams and additional figuration before the big switch, your UA data could have disappeared.
How to tackle this
Make sure you’re updating your tracking code and reporting dashboards. Each data stream has a different measurement ID and you’ll need to use this where appropriate when setting up tracking across your website. Doing so will give you access to incredible tracking abilities. GA4 now tracks a user’s session longer than the previous UA parameters, e.g cutting off after midnight as well as also having the capability for cross device and channel reporting, meaning there is more data available to help inform your strategy.
There isn’t a basic option
Advertisers have emphasised that marketing strategies cannot be confined to a “one size fits all” approach. While certain intricate settings may be suitable for specific users, such as advanced marketers, others, like bloggers, simply want access to fundamental tools within GA4.
For them, navigating through complex features they don’t require becomes a time-consuming process. But even advanced marketers are finding it difficult too. We’d recommend employing help from a marketing agency that knows their stuff to optimise your tracking capabilities.
We happen to know a good one if you need one…
How to tackle this
GA4 can be a little daunting to explore, so training your team on how to use it efficiently is a must. If you’re looking for expert training in GA4, we’ve got you covered. Our Google-partnered team is ready to help you transfer, set up and train your team in everything GA4. So make sure you get in touch with us now.
But why is utilising GA4 important?
Google Analytics 4 comes with a host of innovative features that offer a more comprehensive view of user interactions. With the focus shifting from sessions to events, businesses can now track individual actions taken by users, such as clicks, video views, and downloads, providing deeper insights into user behaviour – making strategies more data informed than ever before.
You can even read more on the benefits of GA4 here.
But what if we told you there was the possibility to integrate GA4 into your existing data touchpoints? To have a perfectly seamless data visualisation dashboard that you could use to inform your strategies and unify all your data in one place.
You’d probably jump at the chance right?
Well start jumping.
Do you know at which points your customers are dropping off and where you need to be advertising to re-engage them?
We can bring all your information touchpoints together and with all data working in unison, you will have the ability to create a seamless predictive model to use in your consumer mapping to enhance ROI and ROAS all year long. Tracking your customers’ level of engagement and planning early for interventions, you will always be one step ahead of the curve.
At Arke, we can paint a picture of your entire ecosystem of consumer touch points to allow you to make real, actionable data driven decisions – and take away the challenges of the new GA4 platform.
For example, for educational institutions, we can collate all the various ID’s assigned to students from CRM’s like Microsoft Dynamic or Hubspot and GA4 into one ID and in one place – making tracking easier than ever before.
If you are ready to level up your tracking, get in touch with an Arkenaut and we can begin your journey to your own seamless data dashboard, taking your marketing strategies to new heights.
With the decision by Google to delay the crumble of third-party cookies until 2024, now is the perfect time to understand, integrate and utilise Google Analytics 4. So, what do you need to know about GA4, and how can your business make the most of it?
What can GA4 do for you?
GA4 is an analytics service that enables your business to measure traffic and engagement across your website or branded apps.
You may already be familiar with Google Universal Analytics which is GA4’s old, soon-to-be outdated version.
GA4 became a hot topic across the web last year as Google announced their plans to remove third-party cookies across Chrome in the near future, making it harder for businesses to gather metrics on audiences.
However, you’ve been given some breathing room, with cookies now likely staying online until 2024. But they won’t be around forever – for SEO and authority urgency – Google recommends businesses to prepare their practices on GA4 sooner than later.
GA4 is a home-runner for businesses looking for accurate, real-time data and want access to AI-powered insights. Here at Arke, we’ve been using it for the past year, living by its improved reporting and campaign measurements.
There’s plenty of analytical software and tools around; what makes GA4 the optimal choice for you?
The benefits of GA4
1. Optimised user journey analysis
GA4 is entirely user-focused and event-driven. Its approach to data means businesses can view a single set of metrics and dimensions to pinpoint and map out the journey a customer goes through.
For example, if a user becomes aware of your brand through their mobile but decides to register or make a purchase in your app, GA4 will keep you posted. These tools will help your business track and piece together the user’s journey accurately and efficiently.
2. Improved privacy options and tracking
In an increasingly ad-heavy environment like the web, privacy is a big concern for audiences. We’ve seen companies, such as Apple, make massive changes to user monitoring – such as the iOS 14.5 update prompting iPhone and iPad users to opt out of tracking in apps.
GA4 gives you and users control over what personal data is collected, meaning your ads will always comply with any further changes to privacy regulations – as long as businesses keep managing the settings correctly.
But don’t panic about missing data due to this! GA4 uses a flexible approach to measurement and will include AI-powered modelling that fills in data gaps that may be incomplete due to a user’s privacy settings.
3. Simple goals and easy event set-up
Go on, add a little laziness to your objectives. We won’t judge, and neither will GA4. From the second you begin using GA4, it will pre-create several actions and events that require little-to-no editing of code or goal set up.
What was once complex is now extremely straightforward. For businesses investing in eCommerce, this is particularly useful when transactional functions, such as application forms and checkouts, are hosted on a sub-domain or third-party site. It’s now very easy and intuitive to “mark” any event as a conversion.
A quick heads up – some form submission and e-commerce goals may not automatically track, but the set-up for these is now much easier and less time-consuming.
Those are just the highlights of what GA4 can offer you. For even more examples of its top-notch benefits – click here.
Why should I be using GA4 now?
For those businesses who may have put off setting up GA4 – you’ve just been given a second chance! Google announced it will officially remove Universal Analytics from service on July 1st 2023.
That may seem like a while away, but consider the insane amount of data and metrics your business may have within it. You can’t migrate across your existing audiences within Universal Analytics – once it’s gone, it’s gone.
However, if you get a head start and set up GA4 whilst using UA, you’ll already have historical data and AI models trained with your data and your user behaviours – so it’s a win-win getting ready now!
How do I implement GA4?
To get the most out of GA4’s metrics and measurements – Google recommends a few of the following:
- If you’re adding GA4 to a site already utilising Universal Analytics, you can use Google’s Setup Assistant to help. This will create a new GA4 property that will collect data alongside the Universal Analytics property and eventually replace it.
- Map Universal Analytics custom events to GA4 – you can access the guide for event migration here. From there, you can migrate your goals and conversions.
- Make sure you leave your UA implementation unchanged. Instead, create duplicate events for your property. Use the new event names and parameters required for Google Analytics properties.
- Have fun testing and exploring the new reports and tools. Our personal favourite is the conversion funnel report.
Those are only a few steps to ensuring a fine-tuned GA4 for your ads or business. If Google’s guide leaves you a little blurry-eyed – we have one more recommendation.
Use Arke!
Analytics and data science are Akre’s bread and butter. Not to brag, but we are Google Analytics Certified Partners – helping businesses build their online branding is what we love to do.
Arke design and implement custom end-to-end industry-specific solutions, so you can transparently track and measure every touchpoint of your customer’s journey; whilst using your data to improve marketing decision-making.
Like to see our work in action? Explore our case study Chesterfield College Group, in which we carried out a data and technology audit for the college, identifying areas of data breaks and sources of erroneous data. This developed into bespoke on-site training sessions, focusing on the activities the college could conduct to enrich the data further.
If you’d like help implementing Google Analytics into your campaign strategy or looking for best practice recommendations regarding your data – contact our team now.
On October 14th 2020 Google announced the introduction of Google Analytics 4. This version of the much-used analytics platform is built upon the App + Web property that was released in beta 2019.
There are some stark differences in the current and new versions. Most pertinently is its use of machine learning to help bring to light insights from the data collected. It’s claimed by Google that the new version of the programme is “privacy-centric by design”. That is, as the collection and sharing of people’s data becomes more regulated, Google Analytics will be able to fill in the information gaps.
In order to remain useful to website owners whilst increasingly reporting on less data, changes had to be made to Google Analytics.
In this blog, we’re going to take a look at some of the following features and benefits of GA4 in more detail:
- Improved Customer Journey Tracking
- Improved user engagement analysis
- More powerful audiences for your ad campaigns
- More intelligent user privacy and tracking features
- Simplified Goals and Events Setup
- Enhanced visualisations and reporting
- A plethora of parameters
1. You see more of the user journey
Google Analytics has really changed – and not just in how it structures its reports within the user interface. It has changed to its core. The focus is no longer on measurements that are easily fragmented by device or platform such as sessions. The emphasis is now firmly on users and their interactions – which are now captured solely as events.
This new user focus and event driven data model means you can now use a single set of metrics and dimensions to look at both web and app data, allowing more intelligent aggregation. For example, a user may visit your website on their mobile device, revisit on their desktop computer, and then download, purchase or register through your app. Google Analytics 4 gives you the tools needed to track and stitch together user journeys more accurately.
2. Analysis tools are more focused on engagement
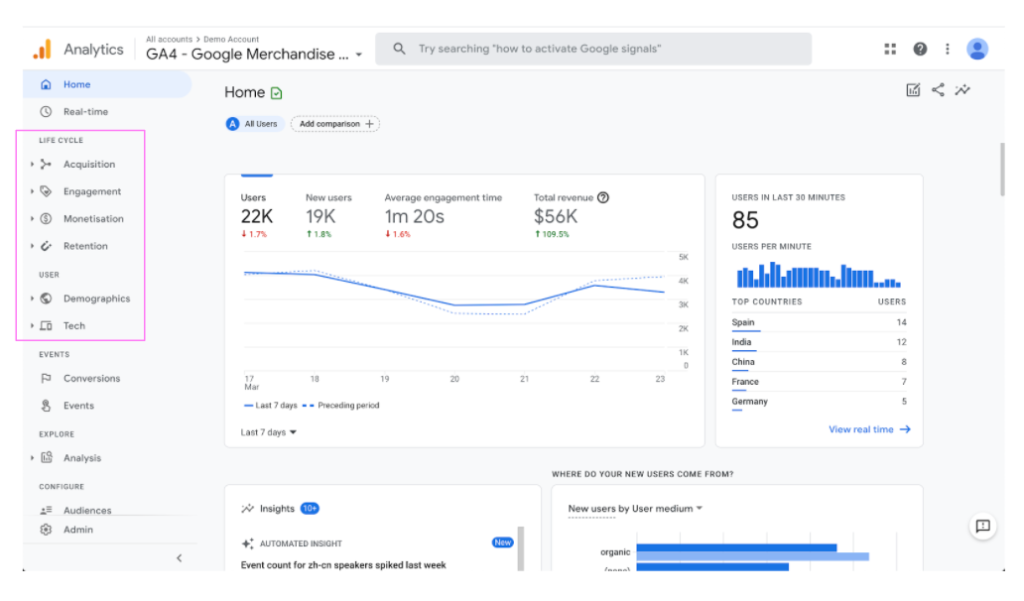
As well as being able to collect and aggregate more data, Google has made it more intuitive for marketers and analysts to dig into user centric reports, by aligning report menu sections with the customer journey.
Gone are the trusty Audience, Acquisition, Behaviour and Conversion menus. In their place is a ‘Lifecycle’ section which divides analysis into Acquisition, Engagement, Monetisation and Retention, whilst there is now a separate ‘User’ section which focuses on user demographics and technology.
One of the best features of Google Analytics 4 is its powerful new user centric metrics and dimensions that use AI to predict customer actions and value.
Meanwhile, Bounce Rate has been done away with by Google and been replaced by some more powerful, and useful, engagement metrics. These new engagement metrics combined with the new pre-configured scroll, video, outbound clicks and file download events should enable you to get a good idea if your content is engaging or if users are engaged with the content.
3. Create powerful audiences for your ad campaigns
GA4 comes with new more powerful measurements, and more powerful analyst tools and integrations means more powerful audiences for marketing campaigns, which means better ROI on ad spend.
For example…let’s say you’re a university running an ad campaign across both mobile and desktop devices, and across web and app platforms. A user comes onto your site through a browser on a mobile and fills out a contact form; they then come back through a desktop computer, using a different browser and begin an application form; they finally complete the application form using your native Android or iOS App…
Until GA4, it would be difficult to optimise ad-spend for these kinds of user journeys – not least because you would struggle to join these different device and platform journeys together. Now, if you configure your web and apps correctly, you can stitch user journeys together and avoid wasting your ad spend.
Additionally, new predictive metrics being released by Google will help to optimise those audiences even quicker and more intelligently. Google has said: “We’re continuing to add new predictive metrics, like the potential revenue you could earn from a particular group of customers. This allows you to create audiences to reach higher value customers and run analyses to better understand why some customers are likely to spend more than others, so you can take action to improve your results.”
4. Intelligent user privacy and tracking features
Google Analytics 4 gives you and your users more intuitive and precise control over what personal data is collected, which will help you comply with current and future privacy regulations. For example, with GA4 you can now exclude specific events and user properties from ads personalisation.
Google’s new approach to analytics is fundamentally designed to be more flexible and adaptable to a future where cookies will be much less common, and where privacy will be an ever more central concern for users and regulatory bodies. GA4 uses a flexible approach to measurement, and, in the not too distant future, will include modeling to fill in the gaps where data may be incomplete.
5. Simplified Goals and Events setup
Termed ‘Event Editing and Synthesis’ by Google, this enables you to really hone goal tracking and get granular behavioural data with little-to-no requirement for editing code, and editing and optimising goal set up. What used to be complex is now straight forward, which will be particularly useful when transactional functions, such as application forms and checkouts, are hosted on a sub-domain or third party site.
Right from the get go, GA4 pre-creates a number of actions and events. Previously requiring manual set up, some default options include clicks, scroll behaviour, transactions, file downloads and a user’s first visit. Some form submission and e-commerce goals may not automatically be tracked, but the set up for these is now made much easier, and again requires much less time to implement than previous iterations of GA.
6. Enhanced visualisations and reporting
Whilst a lot of the UI has remained fairly similar within the platform, there are a number of new visualisations and reporting functions. Existing visualisations and firm favourites such as ‘Real Time’ have been enhanced and made more engaging, but it’s the additional reporting visualisations which are a game changer.
The ‘Analysis Hub’, which features a template gallery with charts which can be created, such as exploration, funnel analysis, segment overlaps and path analysis, is a vast improvement and helps to simplify some more complex cross-dimensional metric reporting.
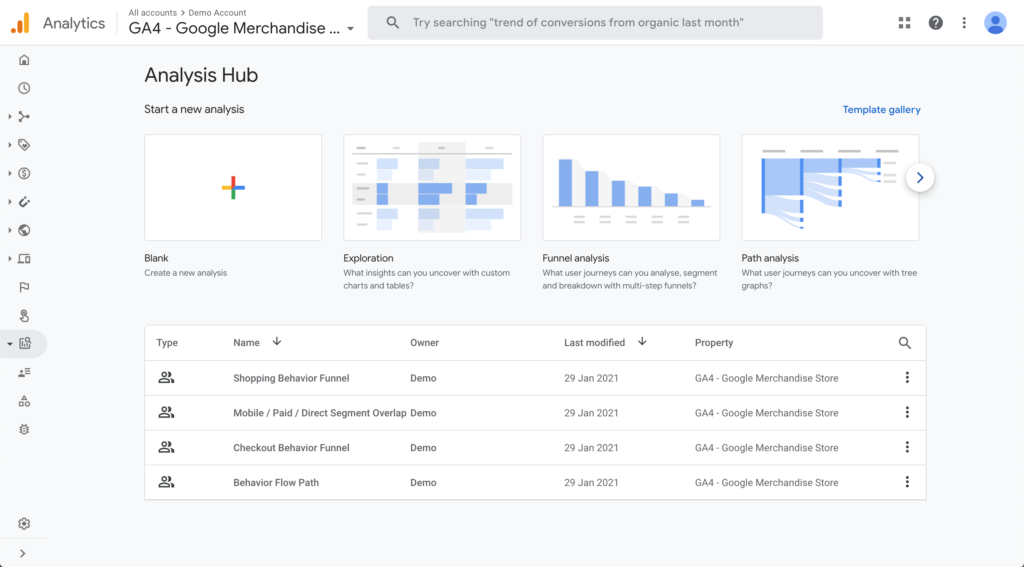
One of the most valuable parts of the ‘Analysis Hub’ is the reporting by ‘Use Case’ and ‘Industries’ which generates templated reports based on typical metrics users would want to see in these areas.
7. A plethora of Parameters
With analytics, having the right data and granularity for certain metrics is absolutely vital to be able to draw value from them. Whilst more data doesn’t always mean better data, having the right parameters is a benefit..
For example, in an e-Commerce setting, parameters can be used to attach the value of a purchase, where the purchase was made, the referring URL and the cross-device journey. Most of the dimensions which were available in the old version are still there, but they’re made more easily accessible and usable with GA4.
Google explains: “In Google Analytics 4 properties, you can send parameters with each event. Parameters are additional pieces of information that can further specify the action the user took, or add further context to the event. For example, parameters can be used to describe the value of purchase, or to provide context into where, how, and why the event was logged. Some parameters, such as page_title, are sent automatically. In addition to the automatically logged parameters, you can log up to 25 parameters with each event. For a game-style event such as level_up, for example, you may want to add parameters such as level_number, character_name, etc. Or, for a content-style event such as content_view, you may want to add parameters such as article_id, article_title, author_name, author_id, and so on. The reports in a Google Analytics 4 property provide information about the events and parameters that were sent from your app and/or website.”
This new and improved GA4 is essentially a re-architecture of the platform we know and love, and the features and benefits are numerous. Whilst it’s still in its infancy and is continuously being developed our number one recommendation is to start learning how to use GA4 effectively now to get ahead of the competition and save time in the future.
We recently ran a masterclass all about Google Analytics 4. We’ve embedded the recording below, but if you’d like to find out more about Google Analytics 4, or to arrange a free 30 minute consultation with our Google Analytics IQ Certified consultants, get in touch now.
On Thursday 25th March, our expert marketing panel hosted the latest episode in our digital masterclass series: ‘Google Analytics 4: what you need to know’.
You might have heard that Google will soon be scrapping third party cookies. Propelled by major shifts in consumer behaviour and privacy-driven changes to longtime industry standards, Google Analytics 4 is there to help overcome what’s been described by some as the ‘rewriting of the rules of the internet’. This masterclass helped prepare attendees for the migration from Universal Analytics to Google Analytics 4, minimising the potential impact and maximising the opportunity it presents.
A huge thank you to everyone who attended and submitted a number of thought-provoking questions…we’ve rounded some of them and our panel’s responses up, so you can digest them at your leisure.
If you want to watch an on-demand recording of the masterclass, we’ve embedded the YouTube video below too.
1. Will the GA update happen automatically or do we need to do something?
GA4 is a new platform in its own right. So yes, you will need to create a new GA4 property within your Google Analytics account, and get it linked to your website either through the code or, ideally, through Google Tag Manager.
2. Can you still build Data Studio reports with GA4 or do you need to build and export reports?
Data Studio will natively connect to Google Analytics 4 just like it does with the existing Google Analytics instance, and it will also connect to Google BigQuery as well. That Google BigQuery integration, up to certain usage, is completely free, unless you’re querying terabytes and terabytes of data a month! Everything will ll integrate natively into Data Studio, as well as a whole host of other platforms. If you do integrate with BigQuery, it will be incredibly fast to interpret and query data.
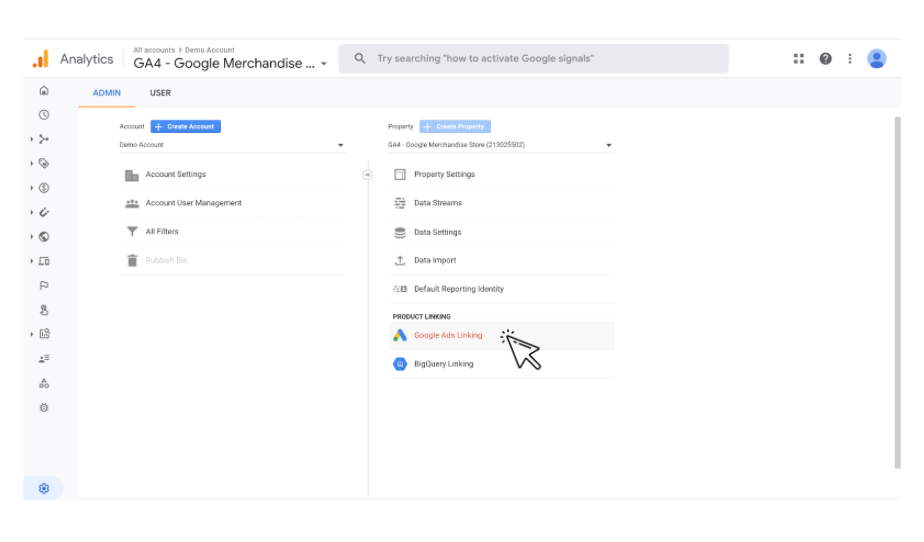
3. How do you import an audience from Google Analytics into Google Ads?
GA4, just like Universal Analytics, supports a native Google Ads link and once you’ve done that all audiences available within GA4 will be available in your Google Ads account, alongside your goals, which are conversions as well. However, you cannot migrate across your existing audiences within Universal Analytics, so implementing GA4 sooner rather than later is recommended to avoid starting from scratch once UA becomes obsolete.
4. Do we interpret engagement rate as the opposite of bounce rate? I.e if there’s a 60% engagement rate can we assume a 40% bounce rate?
No, is the short answer to that! Bounce rate isn’t actually a thing in GA4. In terms of the interpretation of it, bounce rate isn’t the opposite of engagement, and engagement isn’t a bounce. Engagement really should just be an amalgamation or an assembly of touchpoints or key performance indicators that you set up, or decide upon, yourself, that contribute towards certain touch points or certain conversions. So, if an individual doesn’t bounce from page and they click through one page deeper, but then don’t do anything more, we wouldn’t count that as an engagement, but if they then went on and visited three or four more pages, read a blog post and perhaps made an enquiry, that would certainly be an engagement.
It’s very subjective and dependent on what you’re tracking, how deep your funnel is, and what you’re trying to get the users to do on your website that defines your engagement. Bounce rate is just an indication really of page quality and the quality of the user that you’re driving to the page; especially if it’s paid media.
5. When GA4 is set up would it include the old data from universal analytics or start from scratch?
Similar to most things with Google Analytics, it always starts fresh. If you’ve already got Universal Analytics running, you can keep that going and you can pull and merge that data by using a variety of tools. Look outside of Google Analytics and start to understand your data that you’re tracking and how you can do it in GA4. You’ve got plenty of time to make that transition, but in short, you cannot migrate across your data.
6. Is raw data available in BigQuery free from sampling issues or is sampling irrelevant now with the AIs we rely upon?
In terms of the event data from BigQuery, this is a big new advantage. There won’t be any sampling issues when doing a look back of six months. If you’re in Data Studio, or if you’re creating a custom Google Analytics API query, if you’re looking back longer than 6 months, it will start to sample. But, if you’ve got that data from day one going into BigQuery you won’t have any issues with sampling.
In terms of the AI and the way it stitches that data and builds that intelligence, it won’t have much effect on the event data streams that are getting pushed to BigQuery, which is very much like hard data and is not in any way modelled upon. But, it is very much the audience stuff that uses the AI, so if you’re bringing in information around segments of users around certain interaction points, and then using that to compare the event data, you might see some kind of irregularities, but on the whole sampling won’t be an issue.
7. When will it be compulsory to have Google Analytics 4? Is there any benefit in waiting until 2022?
We estimate that Universal Analytics will be redundant in 2022, but all the data will still be in there. As we said earlier, when it goes, so will your data!
We really recommend you start experimenting with GA4 now. Run the two instances side by side until you’re fully comfortable with GA4. You can compare the two instances side by side to ensure that all tracking is in place and you’re tracking what you need. If you get started now, it will be much easier when Google does remove support for Universal Analytics.
If you’re spending any money on paid media, especially in Google Ads, it’s really important that you get GA4 immediately. Those audience definitions are going to become smaller and smaller as platforms and users search the web with fewer and fewer cookies.
That’s a wrap on our Q&A session, if you have any queries in regards to your Google Analytics 4 implementation, get in touch to book a free 30 minute consultation with our experts and as promised the full masterclass is below
How often do you receive a targeting brief with an audience like this?
-
- Markets: UK, France, Italy, US, Germany
- Gender: 60% Male, 40% Female
- Age Range: 18-35
In the example above, we might guess that insights have been gleaned from an overall view of the data due to the lack of overlap between the variables. This means that these conclusions are susceptible to various statistical fallacies that occur when not properly segmenting data.
As a marketing agency, we regularly receive briefs based on a client’s analysis of their customer data to inform our campaign targeting. However, we aren’t always certain that the audiences provided will produce the best results. Data can be strange, especially if the analysis is surface level or oversimplified.
Simpson’s Paradox
One of the most prevalent of these fallacies is the Simpson’s Paradox (also known as the Yule–Simpson effect). Simpson’s Paradox is a phenomenon in statistics in which a trend seen in different groups of data reverses or disappears when the groups are combined.
This paradox is one of the oddest occurrences in statistics and highlights the need for scepticism when interpreting data for real-world applications. Failing to account for it can severely impact your marketing, waste money and negatively affect user experience.
You can read more about the specifics of the Simpsons Paradox here: https://arkeagency.com/news/simpsons-paradox-is-your-data-telling-the-truth/
Continuing with the example above, let’s take a closer look at the gender targeting suggested. When observing the total income from purchases made by gender, we understand how the client has reached the prospective split in targeting:
We see that just over 60% of all purchase income is from male customers, so it would be reasonable to focus a higher percentage of the budget on male prospects.
However, there’s a hidden story in this data. Is that true for all audience segments? We investigate further and observe purchases by gender in each of the 5 given markets:
In fact, when we look at the data more granularly, we see that in all markets but the UK we find the opposite result to when we looked overall, with more of the purchase income generated by women. If we had taken the insights at face value and focused on male prospects in these markets, it could have led to low performance and increased costs.
In this case, Simpson’s Paradox has been caused by a large proportion of male customers in the UK market. The UK is the largest market and so the high number of purchases from males has skewed the overall result when the market segments are combined.
We call the market variable a ‘confounding’ or ‘associated’ variable when considering gender. It is important to take as many of these associated variables into account when reaching decisions from your data.
The impacts of Simpson’s Paradox
As demonstrated, Simpson’s Paradox is especially dangerous in a commercial company or any sector that requires predictions of a person’s intent or behaviour. Incorrect insights may be more readily accepted if the conclusion aligns with our own biases. For example, if the company in question sold boxing equipment, the heavier focus on male prospects could seem reasonable due to existing beliefs and the evidence for this conclusion would be less likely to be interrogated.
In this instance, our bias was correct for the UK but in all other markets, women outperformed men.
Overcoming Simpson’s Paradox
It is vital to identify segments and variables for which an overall analysis produces incorrect results. Targeted variables must be broken out as much as possible, not just in performance reporting but in campaign setup and planning as well. Analysing granular segments is key to combating this common mistake.
There’s added complexity to the campaign for each variable accounted for, and there’s a point where optimisations and setup become overly cumbersome. Too many different audiences can also stretch budget and mean small sample sizes for analysis. Discover key associated variables and ensure that a campaign’s complexity is not disproportionate to the budget.
It’s also important to question insights you are given. Make sure you understand where data has come from, how the analysis was designed and how a conclusion was arrived at. Even an insight that an organisation has historically understood for years may be incorrect if it hasn’t been investigated in an in depth manner.
It can be daunting to tackle this paradox.
-
- Too little or too much data can make it difficult to reach proper conclusions or fully uncover all the associated variables.
- Start with key variables you know you can control and have enough data for statistically significant insights.
- Going just one level deeper (breaking out one confounding variable) can yield surprising results and greatly impact your planning and performance, as shown in this example.
- Keep reassessing your strategy but do not be too hasty.
- Make sure you have a large enough sample size to prove your assertions and once you have that, don’t be afraid to act on new data.
Stay sceptical, interrogate data and find the hidden patterns beneath the surface for truer and powerful insights that you can leverage for your marketing needs.
Get in touch with our data science & analytics experts to find out how to tell stories from your data and make data-based decision making to transform your organisation.
In part one of this series, we introduced you to the Importance of a Testing Culture within your marketing. In case you missed the article, you can check it out here.
So why bother with a testing culture? Ultimately, introducing an AB (or other) testing culture will:
- provide you with a learning purpose to every task, even the most repetitive
- drive a deeper understanding of what’s working and what’s not, helping you to identify new opportunities faster, reducing the time and money wasted on underperforming efforts
- help your company to instil a new approach to being curious and push the boundaries to continually improve
In this follow up, we explore split testing in action using Google Tag Manager. It’s simple to do and the great thing is you probably already have this free technology. If you don’t, then talk to one of our friendly experts today, and we’ll get you set up.

WHAT IS A/B TESTING?
Before we get into the how, let’s just define what it is, and why it’s important.
A/B tests are simply a way of testing two options against each other to identify which one works better. It’s an experiment where two versions of a webpage or ad are shown to users at random, and statistical analysis is used to determine which variation performed better against a given conversion goal.
This is important as it removes subjectivity from your web/ad design choices, enabling data-driven decisions to be made based on what you know, not what you think you know. It allows companies to continually optimise their user experience, learning along the way about the impact changes to their digital channels have on user behaviour.
Testing one change at a time via A/B testing enables companies to pinpoint exactly which changes had an effect on visitors’ behaviour, and which did not. Over time, they can demonstrate the effect of multiple ‘winning’ changes, for example, improving a single goal like conversion rate over time.
It all starts with:
1. IDENTIFYING YOUR GOAL
- Which conversion goal are you testing?
- Conversion goals can be anything from clicking on a button or link to product purchases and email sign-ups

Next, you need to:
2. GENERATE YOUR HYPOTHESES
- Think of A/B testing ideas and hypotheses – why will they be better than the current version?
- Prioritize your list in terms of expected impact and ease of implementation – are there any quick wins you can focus on first?

And now to the nitty-gritty, setting up your experiment on Google Tag Manager.
The aim of this particular experiment is to split test conversion rates from two pages which users are randomly sent to via a submit button redirect.
3. THE VARIABLE
We’ll start by building a custom Javascript variable which outputs either path1 or path2 at random. We achieve this by using the random number variable in GTM which can go up to 2147483647 and refreshes with each page view.
We’ve written the below function which simply asks, is the value less than exactly half of 2147483647? If yes, we return path1 and if no, we return path2. This provides a completely random assignment of either path.

In the GTM debug mode you can test that this works:

4. THE TRIGGER
Next you build your trigger. As you’ll be editing the DOM (Document Object Model), you need to wait until the tag’s finished loading, otherwise you risk not being able to identify the element you’re trying to edit.

5. THE TAG
You now need to build a custom HTML tag and insert a Javascript function – this function includes the element we’re editing (in this instance, a submit button). You then need to insert the value of the ‘href’ redirect link using the ‘Test Path Select’ variable that we built earlier.
**IMPORTANT**
Don’t forget to tick document.write (to safely amend the DOM) and remember to place the function inside <script>….</script> tags as the tag is HTML and needs to know that it’s deploying Javascript.

6. CONNNECT THE TAG TO THE TRIGGER
Finish by connecting the tag to the trigger. If everything works correctly, your button should redirect at random to either of your two test redirect pages.
This same approach would work for changing the text within the button – and even the appearance of the button – if you were to dynamically switch CSS classes. It’s worth noting that you can place the code from the step 1 Javascript variable into the HTML tag, but we’ve found that separating them out keeps typed code to a minimum and easier to understand by the non-developers amongst us.
If you’d like more information on where to start with A/B testing via Google Tag Manager, or any other marketing tests, get in touch with one of our experts or give us a call on 01273 041114.