Google Analytics (GA) is a free tool designed to help you track and report on your website traffic. If you’re already familiar with how to use Google Analytics, then you’ve probably realised that the insights you can gain reach far beyond just your website. In fact, they can be used to enhance your entire marketing strategy, including your paid advertising efforts.
When it comes to running paid advertising, you naturally want to ensure that you are doing all you can to see the best possible return on your investment. But it can be hard to be 100% confident in your planning, and if you’re not achieving the results you want, this is a clue that you haven’t got it quite right.
There are some super-smart marketing intelligence tools out there to help you answer these questions, but they can be pricey. And why would you want to fork out when there’s a treasure trove of free information to be found in your Google Analytics account?
How to Use Google Analytics to Improve Your Advertising
It would be a missed opportunity for marketers not to make use of the free tools available to them. A key skill is knowing how to use Google Analytics to uncover golden nuggets from the abundance of data in your account.
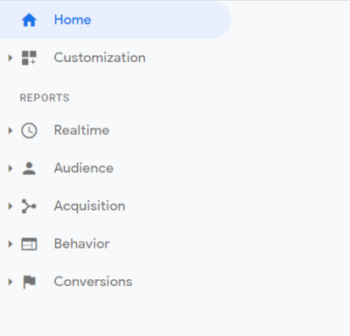
Here are our top 6 learnings you can take from Google Analytics to give your paid advertising a boost. Much of this data can be found in the “Home” overview section, but to drill down and analyse it, it’s best to go into each individual report (don’t worry – we’ll go through how to find everything!).
1. Which Advertising Platform(s) Should You Use?
Google Ads?
Bing?
Facebook?
Instagram?
LinkedIn?
Twitter?
Or something else entirely?
Google Analytics can help you decide!
In the main Reports menu, go to Acquisition → All Traffic → Source/Medium. Here, you will see a list of the places that your website visitors reached your site from. You can sort by Users to see which channel drove the highest number of visitors to your site.
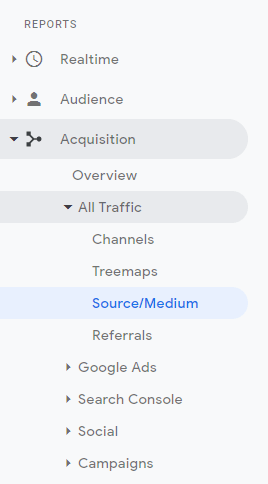
There are other metrics to consider as well, though. Have a look at the Behavior section and sort by Avg. Session Duration. This will tell you, on average, how long visitors from each channel spent on your site and will help you find where your most engaged website visitors came from. It’s true that the overall traffic might be lower than from other channels, but this doesn’t really matter if it is of higher quality. This is important when planning your advertising – you don’t want a load of people clicking on your adverts but leaving your site immediately!
2. Which Locations Should You Advertise In?
The Audience Report in your Google Analytics is the place to go for lots of the good stuff.
For instance, to help you decide the locations you’re going to target with your paid advertising. Let’s face it, unless you have a ginormous budget it’s unrealistic to advertise to the whole world. So if you need a little help with prioritising, start by going to Audience → Geo → Location and have a look at where your website visitors came from.
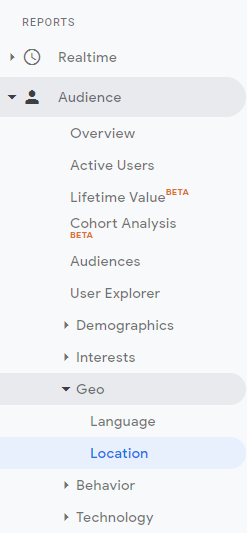
You’ll see a world map with selected countries highlighted. These are the countries your website visitors were in when they were on your site. You’ll also find a table with these countries, along with Behavior metrics for each one. Remember to check these to find out which country generated the highest quality traffic, not just the highest volume.

3. Who Should You Target?
Age and Gender
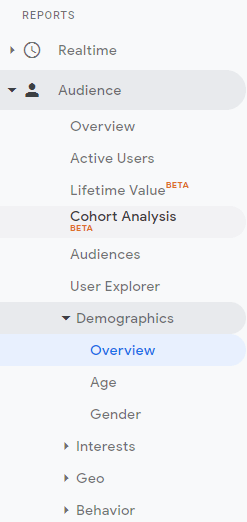
In the Audience tab is also where you’ll find the Demographics of your visitors and see things like their age and gender. You could use this info to inform your targeting strategy, or perhaps to place a bid adjustment prioritising a certain segment of your audience. Go to Audience → Demographics, and then choose either Age or Gender.
Interests
You can also look to the Audience tab to discover the interests of your website visitors and use this to inform your targeting. Navigate to: Audience → Interests → In-Market Segments.

Here, Google sorts your website visitors into interest groups. These groups are decided by what the visitors look at on both your website and the sites of others, as well as terms they search for on Google.
Google Analytics calls these groups “In-Market Segments” because the visitors are actively looking for information on these areas (in other words, they are “in-market” for them).
4. Should You Use Long or Short-Form Advert Copy?
The ideal length for social media adverts is a heavily debated topic. Although generally, your copy needs to be short to be optimised for mobile users and you can get away with it being slightly longer for a desktop audience.
We recommend starting your advertising campaign with a mix of short and longer form advert copy. Then keep a close eye on the results and optimise accordingly, turning off the adverts that are lagging. For example, if the short-form adverts are clearly outperforming their longer counterparts, that’s a sign to prioritise them.
That said, when thinking about whether to use long or short-form, it’s also helpful to be aware of the devices your website visitors use. Do most people visit your site from mobile? Does desktop trump tablet?
For this, go to: Audience → Mobile → Overview for a breakdown of visitor’s devices against Acquisition and Behavior stats (don’t forget: always check the quality as well as quantity!).

5. What Landing Page Should You Use?
The success of your advertising campaign doesn’t rely solely on your adverts. You need to consider the quality of your landing page too.
Think about it; you could have the funniest, most eye-catching, most intriguing advert in all the world… Yet, if a user clicks through and is met with a boring, hard-to-navigate landing page, which is totally irrelevant to the advert they saw, they’ll be out of there quicker than you can say “Google Analytics”!
If you’re planning to use a page that’s already live in your advertising campaign, it’s worth checking its performance beforehand. In Google Analytics, go to Behavior → Site Content → All Pages.

You can then use the search bar to find the page you’re considering using.
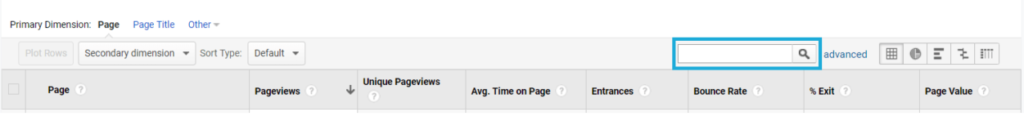
The metrics to check here are:
- Time on Page – Indicates how engaging your page is. Do your visitors stick around for long?
- Bounce Rate – This is the percentage of the total visitors to the page that left your site immediately without interacting with the page at all (AKA their time on page was 0 seconds!)
- % Exit – Shows the percentage of visitors who exited your site from the page. This indicates whether your page has done a good job of keeping your website visitor interested. Has it inspired them to continue browsing your site?
If your page is falling short on any of these metrics, then it’s worth doing some work on it before going live with your advertising.
6. When Should You Run Your Ads?
It’s worth thinking about whether you’re going to run your ads continuously, with an always-on approach, or whether you’re going to prioritise certain days of the week and times of the day. Discovering when your website receives the most traffic can help you decide.
To uncover this info, go to the Home summary report and check the “When do your users visit?” box.
These are the days and times when your website sees the most action. Keep in mind though that they’re not necessarily going to be the best time to run adverts – for one thing, peak usability times vary from platform to platform. Use this info as a starting point for deciding days and times to test.
As you begin to get results from your advertising, you can look out for things like whether you see consistently low engagement at a certain point. If so, consider excluding this day/time to prevent budget wastage.
Thank You Very Much, Google Analytics!
So there you have it; now you know some of the ways we use Google Analytics to help us run smashing advertising campaigns.
The thing is, we’ve only covered a tiny part of how to use Google Analytics. There is so much more data to be found within your account!
The best way to get started is to go into your account and explore. If you find you need more help on how to use Google Analytics, check out Google’s support guide, or get in touch if you’d like some training from our experts.
Are you confident that your Google Analytics account is set-up correctly? There are 5 issues our analysts persistently find in their Google Analytics health checks.
Sign up for a free check with our Senior Web Analyst, Joe, to make sure your GA is primed for optimal performance.